Turn energy, grid, asset, and emissions data into trusted operational intelligence.
Cogrion helps energy and utility organizations connect generation data, renewable contribution, CO2e emissions, grid assets, meter readings, outages, demand signals, maintenance records, and customer impact within one governed intelligence layer.
Move from disconnected utility systems to governed, predictive, and sustainability-ready decisions across generation, grid, assets, customers, and ESG reporting.
Energy and utility teams have more operational data, but not enough connected visibility.
Energy and utility organizations operate across generation systems, smart meters, SCADA, GIS, outage platforms, customer information systems, asset-management tools, billing systems, work-management platforms, weather data, and sustainability reporting systems.
Each system contains valuable information, but these signals often remain disconnected. Grid operations teams need earlier visibility into anomalies and outage risks. Demand planning teams need more accurate load forecasts. Asset teams need to prevent failures before they create service interruptions. Revenue teams must detect billing leakage and suspicious consumption. ESG teams need traceable carbon and renewable-energy reporting for leadership and compliance.
Cogrion connects these fragmented utility signals through an ontology-driven intelligence layer supporting carbon and renewable reporting, customer-meter-asset intelligence, grid anomaly detection, energy demand forecasting, predictive maintenance, and revenue assurance.
Energy and utilities use cases built for action
Each use case connects a utility persona, operational challenge, and Cogrion capability to a measurable grid, asset, demand, revenue, or sustainability outcome.
Carbon and Renewable Energy Reporting
Connect generation mix, renewable assets, fuel types, emissions factors, consumption data, and source-level production to create traceable carbon and renewable-energy reporting.
ESG dashboard, CO2e reporting, renewable percentage tracking, energy-intensity analysis, top-emitting source list, renewable-generation mix, and lineage-backed evidence.
Customer, Asset, and Meter 360
Create a governed utility intelligence layer connecting customers, meters, service locations, grid assets, outages, billing, consumption, work orders, and service history.
Customer-meter-asset relationship graph, governed utility data model, entity match-rate dashboard, asset coverage view, data-quality score, and lineage visibility.
Grid Anomaly Detection
Detect abnormal grid behaviour by connecting smart meters, SCADA signals, outage systems, asset telemetry, weather patterns, and affected customer data.
Grid anomaly alerts, affected asset and customer impact analysis, outage-risk dashboard, restoration-priority recommendations, and operational incident summaries.
Energy Demand Forecasting
Forecast energy demand by connecting meter readings, historical load, weather, tariffs, customer segments, regional patterns, holidays, and consumption behaviour.
Load forecast by region and time window, peak-demand prediction, demand-variance alerts, reserve-margin insights, and capacity-planning recommendations.
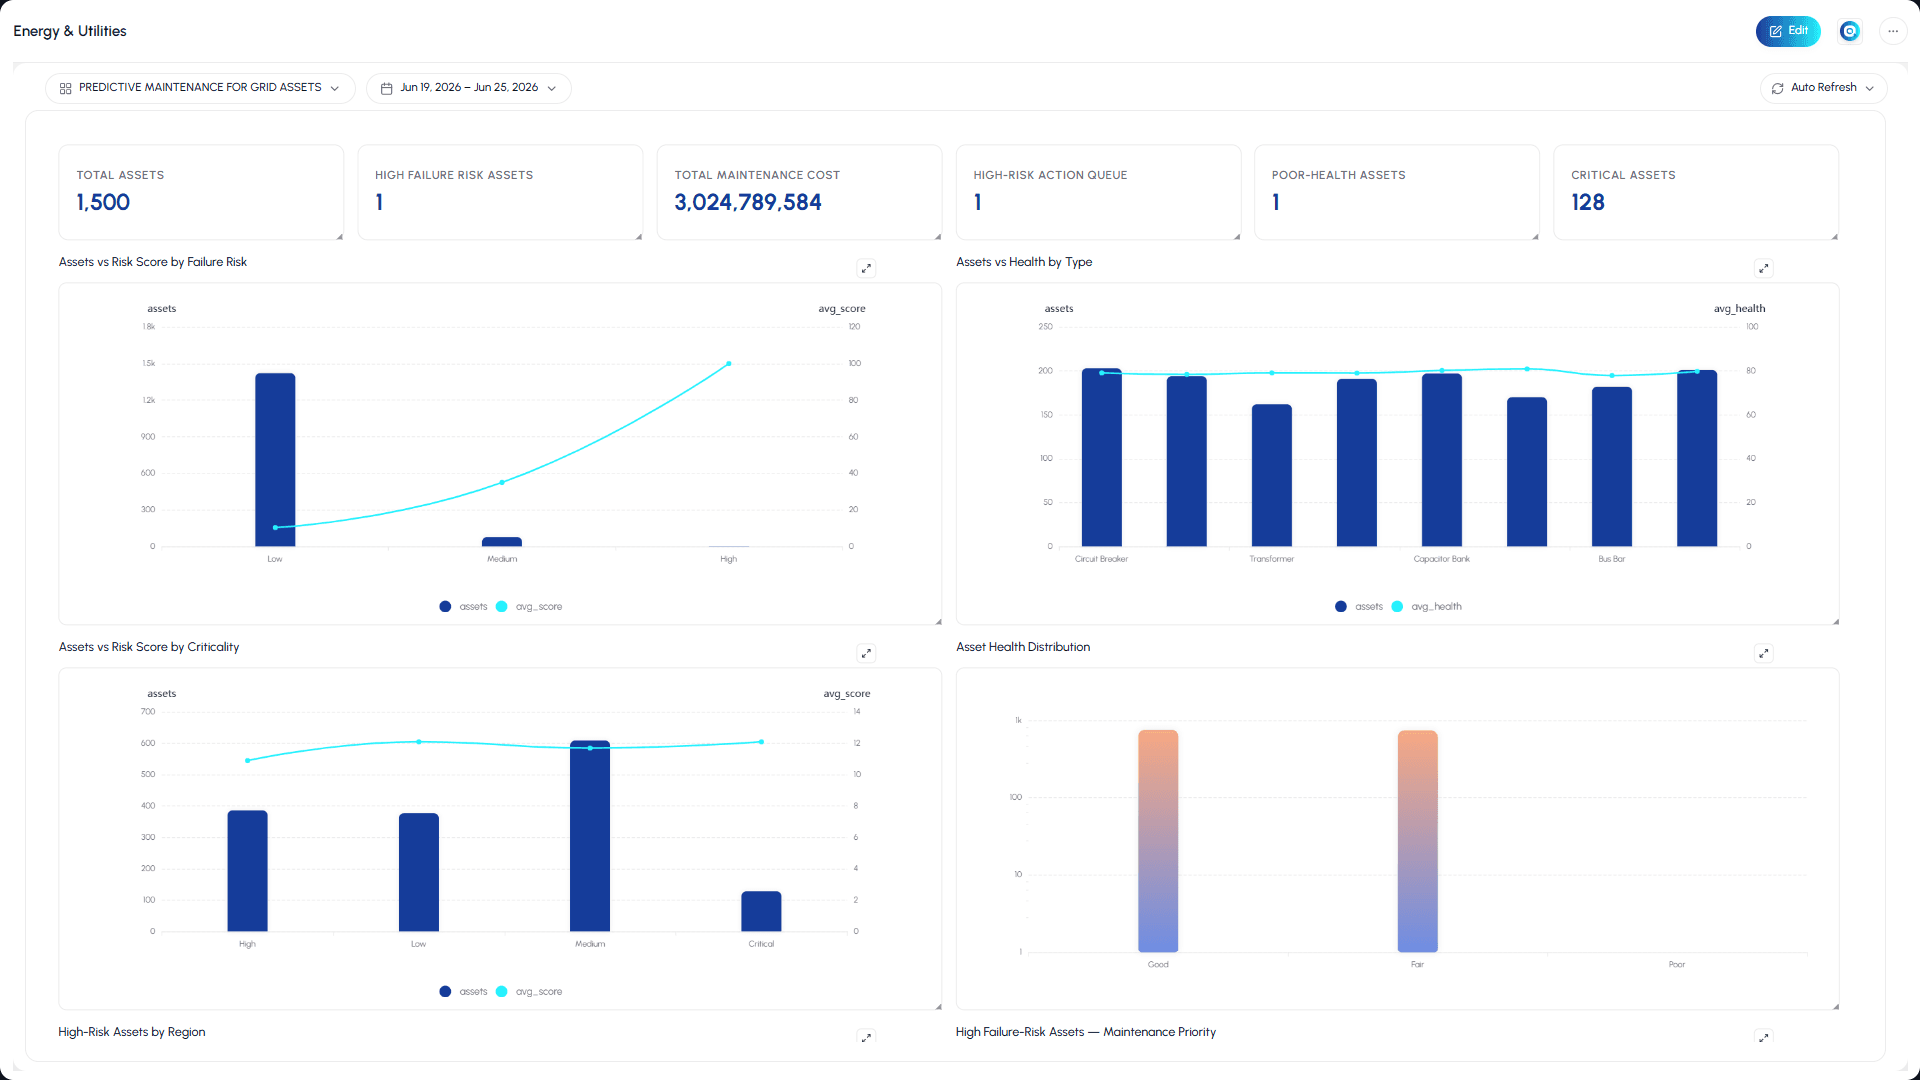
Predictive Maintenance for Grid Assets
Predict asset-failure risk by connecting asset telemetry, inspection history, work orders, maintenance records, operating conditions, failure history, and outage impact.
Asset risk score, maintenance-priority list, recommended maintenance window, failure-probability forecast, MTBF analysis, and outage-impact estimate.
Billing Leakage and Theft Detection
Identify billing leakage and theft risk by connecting meter readings, billing records, customer profiles, inspection outcomes, network-loss indicators, and consumption anomalies.
Suspicious consumption alerts, theft-risk score, high-risk meter list, recovered-value opportunity, investigation queue, and explainable anomaly factors.
Make carbon and renewable reporting traceable, timely, and decision-ready.
Cogrion's Carbon & Renewable Energy Reporting solution helps energy and utility organizations move from fragmented sustainability reporting to governed ESG intelligence. By connecting generation sources, generation type, renewable assets, emissions factors, total generation, CO2e output, energy intensity, and regional contribution, Cogrion gives leadership and sustainability teams a reliable view of emissions performance and renewable-energy progress.
Energy and Emissions Overview
Monitor total generation, total CO2e, renewable generation, renewable percentage, top emitting source, and generation source count.
Generation vs CO2e by Category
Compare renewable and non-renewable generation with associated CO2e to understand how the generation mix impacts emissions.
CO2e by Generation Type
Analyze emissions and emission factors across coal, gas, biomass, solar, wind, hydro, and nuclear generation sources.
Generation and Renewable Percentage by Region
Track generation volume and renewable contribution across regions to identify areas with stronger renewable adoption or higher dependence on non-renewable sources.
Monthly Renewable Percentage and CO2e Trend
Monitor renewable contribution and CO2e movement over time to identify progress, seasonality, and emission reduction opportunities.
Top CO2e Emitting Sources
Provide sustainability and operations teams with a searchable list of generation sources by source ID, source name, generation type, CO2e, generation output, and energy intensity.
Renewable Generation Mix
Understand the renewable generation contribution across solar, wind, hydro, and other low-carbon sources.
How Cogrion turns energy and utility data into trusted action
Connect
Bring together generation systems, SCADA, smart meters, GIS, customer information systems, billing, outage systems, work management, asset telemetry, weather data, inspection records, renewable assets, and emissions factors.
Govern
Catalogue, validate, standardize, secure, and trace utility data through lineage, ownership, access controls, data-quality rules, asset hierarchy mapping, emissions-factor governance, and audit-ready reporting.
Understand
Build connected context across customers, meters, service locations, grid assets, substations, generation sources, regions, outages, consumption, emissions, renewable assets, work orders, and billing activity through Cogrion's ontology and semantic layer.
Predict
Generate intelligence around demand load, peak usage, grid anomalies, asset failure risk, outage impact, suspicious consumption, billing leakage, CO2e trends, and renewable contribution.
Prioritize
Rank assets, anomalies, outage risks, high-demand regions, suspicious meters, emitting sources, and maintenance actions according to urgency, risk, customer impact, and business value.
Act
Turn intelligence into dashboards, alerts, maintenance plans, demand forecasts, theft investigations, outage interventions, ESG reports, and renewable-energy decisions.
Energy and utilities outcomes Cogrion helps enable
One governed intelligence layer across the utility value chain
Cogrion does not replace SCADA, smart meter, GIS, billing, asset-management, outage-management, or ESG systems. It connects and strengthens them. By combining governed data, utility-domain relationships, semantic metrics, predictive intelligence, and AI-assisted recommendations, Cogrion helps teams make trusted decisions across generation, grid operations, demand planning, asset maintenance, revenue assurance, and sustainability reporting.
Utility-aware context
Connect customers, meters, service locations, assets, substations, generation sources, outages, consumption, work orders, billing, renewable assets, and emissions factors through an ontology built around how utilities actually operate.
Governed sustainability intelligence
Ensure carbon, renewable, energy-intensity, and generation metrics are supported by traceable, reliable, and controlled data — with full lineage and audit-ready evidence.
Predictive operational support
Move from delayed reporting to proactive action on demand spikes, grid anomalies, asset failures, outages, theft risk, and emission hotspots.
Persona-specific experiences
Deliver relevant dashboards and action queues to ESG teams, grid operations, demand planning, asset maintenance, revenue assurance, and data teams.
Ready to turn energy data into trusted utility intelligence?
See how Cogrion helps energy and utility organizations connect generation, emissions, renewable assets, grid, meter, customer, outage, billing, and maintenance data within one governed intelligence layer. Strengthen carbon reporting, improve renewable visibility, predict demand and asset risks, detect leakage, and help teams act before operational and sustainability risks increase.