Turn manufacturing data into intelligent production, quality, and supplier decisions.
Cogrion helps manufacturers connect supplier orders, production data, machine signals, quality records, inventory, maintenance logs, and plant performance metrics into one intelligent operational layer.
Move from fragmented factory and supply-chain systems to governed, predictive, and business-prioritized manufacturing decisions.
Manufacturing teams have production data, but not enough operational clarity.
Modern manufacturing teams operate across ERP, MES, SCADA, IoT sensors, supplier systems, inventory platforms, quality systems, CMMS, production logs, and maintenance records.
Each system produces valuable information, but these signals often remain disconnected. Plant heads struggle to track performance in real time. Maintenance teams identify equipment failure risks too late. Quality teams cannot easily trace defects back to batches, machines, suppliers, or materials. Supply chain teams lack early visibility into supplier delays and material risks. Leadership needs a clearer view of production performance, operational bottlenecks, and value at risk.
Cogrion connects these fragmented manufacturing signals through an ontology-driven intelligence layer that supports supplier delay prediction, plant performance monitoring, predictive maintenance, quality root-cause analysis, energy optimization, and governed industrial data intelligence.
Manufacturing use cases built for action
Each manufacturing use case connects a specific industrial persona, operational challenge, and Cogrion capability to a measurable manufacturing outcome.
Asset and Production Ontology
Create a connected industrial data foundation that maps machines, production lines, batches, materials, suppliers, quality records, and operational processes through Cogrion's ontology layer.
Plant-machine-batch-quality relationship graph, governed industrial data model, lineage view, data-quality score, and asset-to-process mapping.
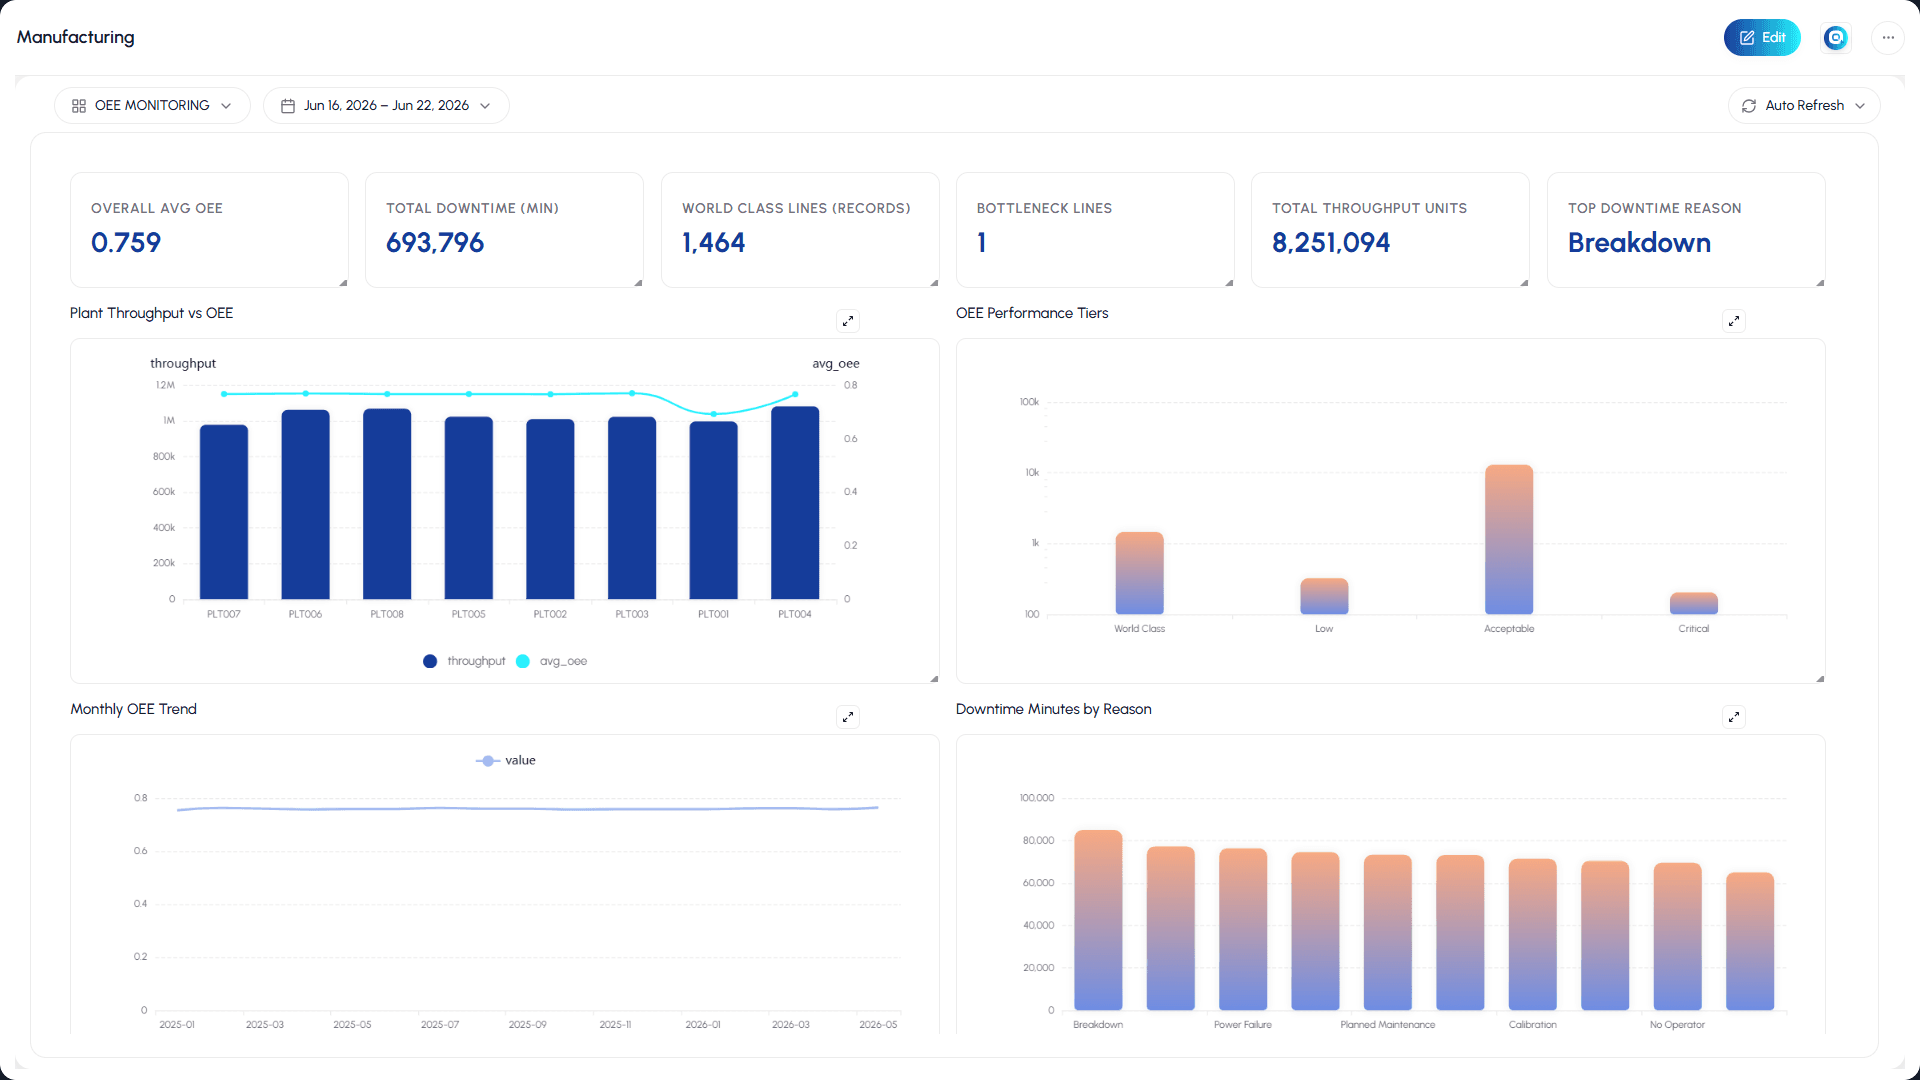
OEE Monitoring and Plant Performance Intelligence
Give plant leaders a governed performance view across production lines, machines, shifts, batches, defects, downtime events, and throughput trends.
Plant performance scorecard, OEE dashboard, downtime analysis, throughput trends, bottleneck view, and production-efficiency insights.
Predictive Maintenance
Predict machine failure risk by connecting IoT sensor data, maintenance logs, asset registry, work orders, operating conditions, and historical downtime patterns.
Machine failure-risk score, recommended maintenance window, anomaly alerts, downtime-risk forecast, MTBF/MTTR tracking, and maintenance-priority list.
Production Quality Analytics
Connect inspection results, batch records, supplier lots, machine settings, operators, production lines, and defect patterns to identify root causes and reduce quality losses.
Defect root-cause analysis, quality heatmap, scrap and rework analysis, first-pass yield dashboard, and batch-level quality traceability.
Supplier Performance and Delay Prediction
Predict supplier delays by connecting supplier orders, inventory levels, shipment status, lead times, production plans, purchase orders, and supplier performance history.
Supplier risk dashboard, delay prediction, on-time delivery score, lead-time variance analysis, high-risk supplier list, and value-at-risk view.
Energy Consumption Analytics
Link energy consumption with machines, production lines, batches, output, peak-load periods, tariffs, and emissions to identify cost-saving and sustainability opportunities.
Energy-per-unit dashboard, peak-load analysis, cost-per-batch view, emissions tracking, anomaly alerts, and optimization recommendations.
Predict supplier delays before they disrupt production.
Cogrion's Supplier Performance and Delay Prediction solution helps manufacturers move from reactive supplier follow-ups to proactive supply-chain intelligence. By combining supplier orders, purchase orders, shipment status, inventory levels, lead times, supplier history, country-level performance, and value-at-risk data, Cogrion identifies which suppliers are likely to delay, how much production value is at risk, and where supply-chain teams should act first.
Supplier Performance Overview
Monitor total orders, overall on-time percentage, high-delay suppliers, average lead time, worst suppliers, and total value at risk.
Supplier Orders vs On-Time Percentage
Compare supplier order volume with on-time delivery percentage to identify suppliers with high operational dependency and weak reliability.
Supplier Performance by Country
Track supplier performance across countries to identify regional delay patterns, sourcing risks, and country-level reliability trends.
Delay Rate by Supplier Tier
Compare delay rates across supplier tiers to identify whether critical suppliers, strategic vendors, or lower-tier suppliers create the highest disruption risk.
Monthly Supplier Delay Trend
Monitor delay-rate movement over time to identify recurring delays, seasonal disruption patterns, and improving or worsening supplier performance.
High-Delay Supplier Identification
Highlight suppliers with delay rates above the threshold, such as suppliers crossing 30% delay risk, and prioritize them for review.
Worst Suppliers — Delayed Orders and Value at Risk
Provide procurement and supply-chain teams with a searchable table of suppliers, delayed orders, countries, supplier names, and risk indicators.
How Cogrion turns manufacturing data into action
Connect
Bring together ERP, MES, SCADA, IoT sensor data, supplier orders, purchase orders, inventory systems, production plans, quality systems, maintenance logs, CMMS, and energy data.
Govern
Standardize, validate, secure, and structure manufacturing data using cataloguing, lineage, access controls, data-quality rules, ownership mapping, and governed semantic metrics.
Understand
Build connected context across plants, machines, production lines, batches, materials, suppliers, purchase orders, inventory, defects, maintenance events, energy usage, and operational workflows through Cogrion's ontology layer.
Predict
Generate intelligence around supplier delays, machine failure risk, downtime probability, quality defects, energy anomalies, production bottlenecks, and value at risk.
Prioritize
Rank suppliers, machines, production issues, maintenance actions, quality risks, and operational bottlenecks based on business impact, urgency, probability, and production dependency.
Act
Turn intelligence into dashboards, supplier-risk alerts, maintenance recommendations, quality investigations, production actions, energy-optimization opportunities, and operational workflows.
Manufacturing outcomes Cogrion helps enable
One intelligence layer across the manufacturing value chain
Cogrion does not replace ERP, MES, SCADA, CMMS, supplier, or quality systems. It connects and strengthens them. By combining governed data, manufacturing-domain relationships, semantic KPIs, predictive intelligence, and AI-assisted recommendations, Cogrion helps manufacturing teams make better decisions across procurement, production, maintenance, quality, energy, and operations.
Manufacturing-aware context
Connect suppliers, materials, purchase orders, machines, batches, production lines, plants, quality checks, maintenance events, and energy signals through an ontology built around how manufacturing actually works.
Governed industrial intelligence
Ensure that dashboards, predictions, and operational recommendations are supported by reliable, traceable, and controlled manufacturing data — with full lineage and data-quality visibility.
Predictive decision support
Move from reactive reporting to proactive action across supplier delays, machine failures, defects, bottlenecks, and operational risk — with AI-driven intelligence that surfaces what matters before it becomes a problem.
Persona-specific experiences
Deliver relevant dashboards and actions to plant heads, supply-chain leaders, maintenance teams, quality teams, sustainability managers, and data-governance teams — each in the context they need.
Ready to turn manufacturing data into operational intelligence?
See how Cogrion helps manufacturing teams connect supplier, production, machine, quality, inventory, maintenance, and energy data into one governed intelligence layer. Predict supplier delays, improve plant performance, reduce downtime, identify quality root causes, and help teams act before operational risk becomes production loss.