Turn freight quote data into intelligent pricing, sales, and win-rate decisions.
Cogrion helps logistics and freight teams connect quote history, customer segments, pricing competitiveness, sales rep performance, industry demand, quote status, and win probability into one intelligent commercial decision layer.
Move from reactive freight quoting to governed, predictive, and revenue-prioritized sales decisions.
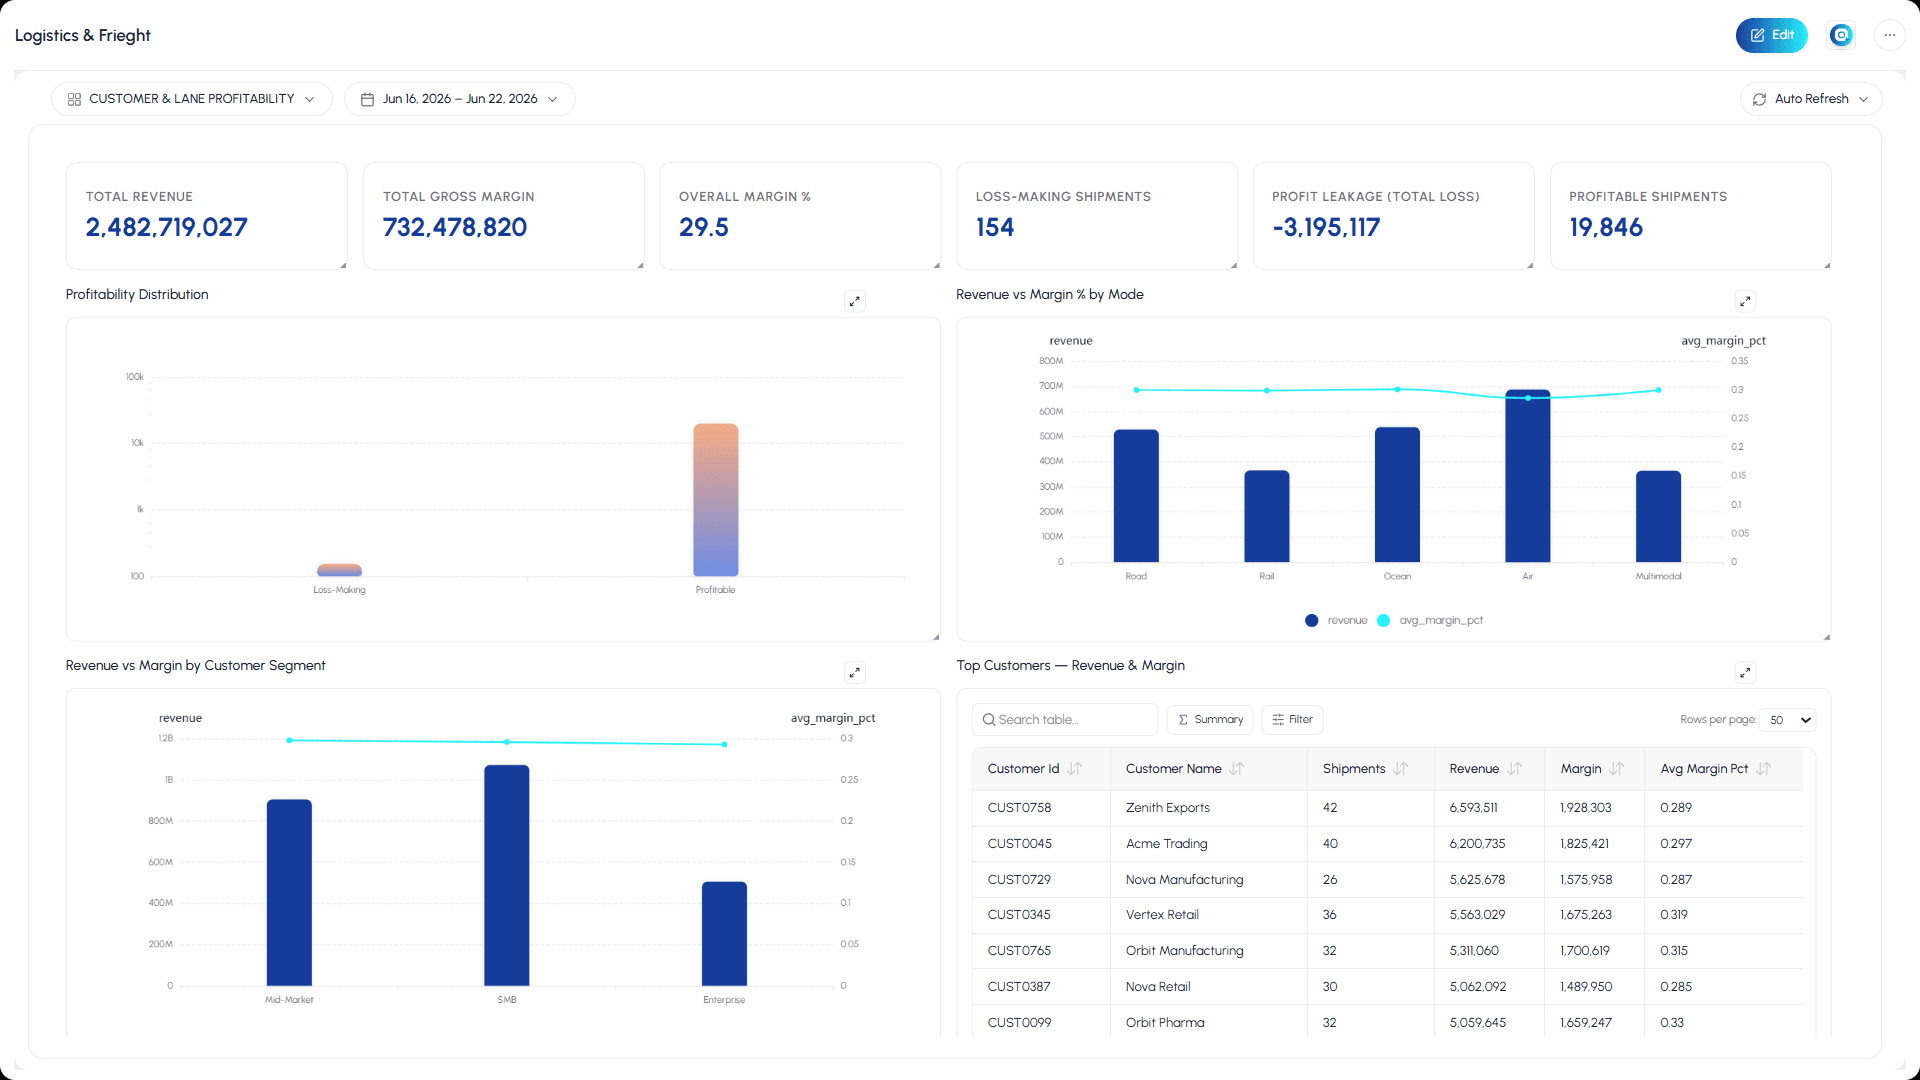
Logistics teams have quote data, but not enough commercial clarity.
Modern logistics and freight companies operate across TMS, CRM, rate-management systems, carrier databases, shipment platforms, customer records, pricing tools, sales pipelines, and finance systems.
Each system contains valuable commercial signals, but these signals often remain disconnected. Sales teams struggle to identify which quotes are most likely to convert. Pricing teams need better visibility into whether quotes are competitive, too expensive, or underpriced. Managers need to understand which segments, industries, customers, and sales reps are driving revenue. Leadership needs a clearer view of quote performance, win probability, lost opportunities, and revenue at risk.
Cogrion connects these fragmented freight and commercial signals through an ontology-driven intelligence layer that supports quote win prediction, pricing competitiveness analysis, customer prioritization, sales rep performance tracking, and freight revenue optimization.
Logistics and freight use cases built for action
Each logistics use case connects a specific business persona, operational challenge, and Cogrion capability to a measurable freight and revenue outcome.
Quote Win Probability
Predict quote win probability by connecting quote value, customer history, pricing competitiveness, sales rep performance, customer segment, industry, quote status, and previous win/loss patterns.
Quote win-probability dashboard, high-priority quote list, predicted win band, sales follow-up recommendations, and revenue opportunity view.
Freight Pricing Competitiveness
Compare quote price competitiveness with win rate, customer segment, industry, lane history, revenue value, and quote outcome to identify where pricing needs adjustment.
Price competitiveness dashboard, win-rate comparison, margin-risk indicators, pricing band recommendations, and commercial decision support.
Customer and Segment Intelligence
Create a connected customer intelligence view that links quote history, shipment behaviour, revenue value, win rate, customer segment, industry, service preferences, and engagement patterns.
Customer 360 view, segment-level win-rate analysis, account opportunity score, customer quote history, and growth-priority list.
Sales Rep Performance Intelligence
Track sales rep performance by connecting quote volume, won value, win rate, customer type, quote status, pricing competitiveness, and high-probability opportunities.
Top sales rep dashboard, won value ranking, rep-level quote performance, open quote priority list, and sales coaching insights.
Freight Revenue and Industry Win Analysis
Analyze won quotes by industry, segment, customer group, pricing band, and quote value to identify revenue patterns and commercial growth opportunities.
Won quotes by industry dashboard, revenue contribution view, segment performance analysis, industry opportunity score, and commercial strategy insights.
High-Probability Open Quote Prioritization
Identify open quotes with high win probability by connecting customer name, rep ownership, quote value, predicted win score, pricing competitiveness, and quote status.
High-probability open quote list, close-these-next recommendations, quote status tracking, owner-level action list, and revenue-at-risk view.
Prioritize the freight quotes most likely to convert.
Cogrion's Quote Win Probability solution helps logistics and freight companies move from manual quote tracking to predictive commercial intelligence. By combining quote value, customer history, pricing competitiveness, sales rep ownership, customer segment, industry, quote status, and historical win/loss patterns, Cogrion identifies which quotes are most likely to convert, which need immediate follow-up, and where commercial teams should focus first.
Quote Performance Overview
Monitor total quotes, overall win rate, high win-probability quotes, total won quotes, priority quotes, and top rep won value.
Predicted Band vs Actual Win Rate
Compare predicted win-probability bands against actual win rates to understand how quote scoring aligns with real outcomes.
Quote Volume vs Win Rate by Segment
Analyze quote volume and win rate across customer segments such as SMB, mid-market, and enterprise to identify where conversion is strongest.
Price Competitiveness vs Win Rate
Compare cheaper and pricier quotes against win rate to understand how pricing position affects quote conversion.
Won Quotes by Industry
Track won quotes across industries such as manufacturing, retail, food, pharma, trading, exports, and other customer groups.
Top Sales Reps by Won Value
Identify which sales reps are generating the highest won value and understand quote performance by owner.
High Win-Probability Open Quotes
Provide sales teams with a searchable list of open quotes prioritized for closure, including quote ID, customer name, rep name, quote value, win probability, predicted band, price competitiveness, and quote status.
How Cogrion turns logistics data into action
Connect
Bring together CRM data, freight quotes, TMS records, shipment history, pricing data, customer accounts, sales rep ownership, carrier rates, invoice data, customer segments, and industry information.
Govern
Standardize, validate, secure, and structure logistics and commercial data using cataloguing, lineage, access controls, data-quality checks, ownership mapping, and governed semantic metrics.
Understand
Build connected context across customers, quotes, sales reps, lanes, carriers, pricing bands, industries, customer segments, quote status, shipment history, and revenue outcomes through Cogrion's ontology and semantic layer.
Predict
Generate intelligence around quote win probability, price competitiveness, customer conversion likelihood, high-value opportunities, segment performance, and revenue risk.
Prioritize
Rank quotes, customers, industries, sales reps, and follow-up actions based on win probability, quote value, urgency, pricing position, and commercial impact.
Act
Turn intelligence into dashboards, sales priority lists, pricing recommendations, rep performance insights, customer actions, quote follow-up workflows, and revenue decisions.
Logistics and freight outcomes Cogrion helps enable
One intelligence layer across the freight commercial lifecycle
Cogrion does not replace CRM, TMS, pricing, shipment, or finance systems. It connects and strengthens them. By combining governed data, logistics-domain relationships, semantic KPIs, predictive intelligence, and AI-assisted recommendations, Cogrion helps freight teams make better decisions across quoting, pricing, customer prioritization, sales follow-up, revenue management, and commercial strategy.
Logistics-aware context
Connect customers, quotes, lanes, carriers, pricing bands, shipment history, sales reps, customer segments, industries, and revenue outcomes.
Governed commercial intelligence
Ensure win-rate metrics, pricing analysis, quote predictions, and revenue insights are supported by reliable, traceable, and controlled data.
Predictive sales prioritization
Move from manual quote tracking to proactive action on high-probability, high-value, and time-sensitive freight opportunities.
Persona-specific experiences
Deliver relevant dashboards and action lists to sales heads, pricing teams, revenue leaders, account managers, sales operations, and freight sales teams.
Ready to turn freight quote data into revenue intelligence?
See how Cogrion helps logistics and freight teams connect quote, customer, pricing, sales, shipment, and revenue data into one governed intelligence layer. Predict quote win probability, prioritize high-value opportunities, improve pricing decisions, and help teams act before revenue opportunities are missed.